- Pharmaceutical Technology-11-01-2012
- Volume 2012 Supplement
- Issue 6
Determination of Higher Order Structure and Hydrogen Deuterium Exchange by LC–MS
Hydrogen deuterium exchange by mass spectrometry is a powerful analytical approach that can be used to map higher order structures of proteins.
Determination of primary protein structure has long been manageable and increasingly automated by the hyphenated technique of liquid chromatography and mass spectrometry (LC–MS). Higher order structure (HOS) can now also be mapped with the same tools, such as disulfide bond mapping, due to the increased power and capabilities of LC–MS (1). Most recently, the commercialization of ion mobility mass spectrometry and hydrogen deuterium exchange by mass spectrometry (HDX–MS also referred to as H–D exchange or HXMS) has changed the shape of analytical technology (2). Researchers in the field are now confident that numerous technical challenges of this powerful analytical approach have been overcome (3, 4).
HDX–MS uses a simple principle, first exploited decades ago by Lindestrom-Lang, that the solvent accessibility of amide protons in proteins varies dynamically. By examining the changes over the course of an experiment, different protein states can be compared with each other to understand protein binding, to map epitopes, to understand the effect of modifications or small molecule binding, or even to manage the effects of formulation (5). Smaller sample sizes (e.g., picomoles) may be used compared with other techniques, and HDX–MS can be used to study proteins that are hard to purify. Typically, pepsin digestion, which cleaves the protein into small peptides, is used. The labeling is quenched chemically, and deuterium incorporation can be localized to short stretches (e.g., 5 to 10 amino acids) of the primary structure by measuring the resultant mass change in that peptide (6).
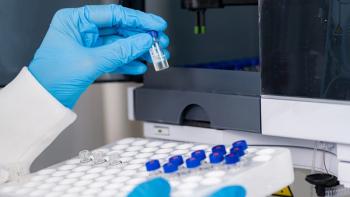
However, deuteration is a dynamic process, and deuterons and protons will exchange back and forth. To help control this process after the initial uptake, the analytical separation is cooled to 0 °C to manage the "back" exchange. The cold pathway and chemical quenching dramatically slow the reversal of deuteration and provide a window for chromatographic separation as close to the MS detector as possible (1, 7). In one instrument, built with guidance from an academic and industry partnership, sub-2-μm ultra-performance LC (UPLC) separations take place within a cooled environment that is paired with robotics-enabled injection (Waters, nanoACQUITY UPLC System with HDX Technology). This technique works for large molecules such as antibodies, the characterization of protein-ligand interactions, mutation effects, and epitope mapping (8–12).
Commercialization of HDX–MS
Commercializing a complete solution for HDX–MS—from robotic process handling to data handling—was an important leap for industry, in that it adopted a hitherto academic technique into the real world (13). The underlying factors that were addressed to ensure successful adoption by industry were that mass spectrometry detection be robust and the instrument be engineered for simple start-up by scientists. In research departments, companies that have adopted HDX–MS use MS in several different ways, principally to fill the therapeutic pipeline. For example, in new medicines laboratories, HDX–MS can rapidly perform epitope mapping to tie up intellectual property in the paratope and epitope (14).
Incorporation of brute capabilities, such as UPLC and ion mobility mass spectrometry (IMS), greatly facilitates the studies. As more complex proteins are analyzed, it also becomes increasingly useful to include ion mobility separations to disentangle the data (2). IMS provides an orthogonal differentiation to mass differences and chromatographic separation. Untangling the puzzle of data is therefore easier because there are more angles to look at (i.e., better specificity). Researchers can also begin to look at intermediates in the binding process and understand more clearly why certain domains are active and others are less active. This technique has recently been demonstrated in studies of kinase binding and the detailed understanding of allosteric effects (15).
Historically, curating HDX–MS data manually was inefficient and required expert interpretation. Because interpretation is a repetitive process that requires counting and measuring spectra, the process can be automated. Building software specifically designed to systematically select spectra with predetermined criteria and measure the mass change of the deuterated forms was one of the criteria to make HDX–MS acceptable to industry (13). No longer do users need to be experts in instrumentation and interpretation; HDX–MS has now become accessible to biologists and biochemists.
Tools appropriate to biologists and biochemists are not enough; the data display needs to be more intuitive. More recent iterations, therefore, have concentrated on showing conformation in relation to a protein map or to differences between two states that relate to the protein sequence, rather than the spectral readout from the instrument themselves. This display requires transposition, overlaying of primary sequence, and color schemes that are more appropriate to human visual interpretation. Recent developments have allowed the superposition of the MS readouts onto three-dimensional crystal structures of proteins or as "heat maps" of change related to primary sequence (13). These intuitive plotting schemes provide a rapid, visual comparison of different states, such as bound and free forms of the proteins of interest (13). A "butterfly" chart provides a rapid visual overview of the average relative fractional exchange for all peptides in each labeling time-point. The "inflection" points of the chart highlight the total amount of exchange as well as the rate of exchange, thus highlighting the active regions of the protein at a glance. The entire polypeptide backbone of each form can now be compared for both spatial and temporal information.
Comparability and biosimilarity
Comparability has been an important aspect of biotherapeutic development since the advent of the well-characterized biotherapeutic product guidelines established in the 1990s. These formalized FDA guidelines were a boon to the development of biotherapeutics because they offered a pragmatic pathway to characterizing multiple elements and trying to relate them to the clinic. As time has progressed, many default techniques, such as peptide mapping and glycan profiling, have become increasing automated. Indeed, the automation of these techniques routinely uncovers important issues such as sequence variation in biosimilar candidates or variations in glycosylation profiles (11, 16, 17).
With the advent of HDX–MS, the comparability toolbox can be extended further into the realm of HOS. Comparability in HOS was aptly demonstrated by a study of a commercial growth hormone that was covalently attached to a polyethylene glycol (PEG) polymer (i.e., PEGylated) (18, 19). In that study, the authors used HDX–MS to analyze granulocyte colony stimulating factor (G-CSF) upon PEGylation. PEGylation is known to reduce immunogenicity and antigenicity and may prolong circulating time (20). FDA has approved a number of biotherapeutics that are PEGylated, and many more are believed to be in the pipeline (18, 19).
PEGylation may induce conformational changes, steric interferences, and changes in electrostatic binding (21). The researchers performed a number of experiments to obtain an overall picture. Three undeuterated experiments and two complete HDX experiments were performed for each protein. In total, 10 separate experiments were performed for all forms of G-CSF within two consecutive days, which helps illustrate the importance of automation and robotics.
Significant differences in deuterium incorporation were induced by PEGylation of G-CSF, but the researchers concluded that the changes were quite small and that PEGylation did not result in gross conformational rearrangement of G-CSF (5). The raw differences between specific peptides in the protein chain were charted automatically; if the value of differences exceeded an empirically-determined amount (i.e., 1.5 Da), it was considered significant. The decisions about significant differences are also captured by performing triplicate acquisitions, thus providing a proper basis for judgment. Controls were also used with totally separate duplicate runs of G-CSF or PEGylated G-CSF to demonstrate that the differences observed in the plots of PEGylated versus non-PEGylated were real.
With HDX–MS, this type of study can be directly matched to clinical trial data, especially in situations for which it is known that HOS changes may occur. For this study, the authors commented that the data complexity was greatly reduced though a data processing and presentation format that was designed to facilitate their comparison process. The study demonstrated the immediate utility of HDX–MS for comparability studies as well as protein therapeutic characterization in the biopharmaceutical industry.
In 2012, FDA released guidelines on biosimilars that specifically called for studies of HOS, following earlier testimony to the US Congress (22, 23). Many national guidelines have, until now, tended to use an all-encompassing description such as "state-of-the-art" technology. The FDA guidelines of 2012 potentially reflect the rapidly expanding set of analytical tools for biotherapeutics, as well as an understanding that techniques to study HOS are increasingly routine.
Even in studies of insulin, which is an extremely well-characterized protein, there is recent evidence for the importance of characterizing HOS to match an innovator product's efficacy. In a case in which a biosimilar insulin was well-characterized, the primary structure, downstream processing aspects, and manufacturing processes were well understood. Unfortunately, the submission failed when clinical data indicated different pharmacokinetics that may well have been predicted by HOS studies (24). The need to characterize HOS is of worldwide concern, as is clear from the wide variety of geographies where such studies are taking place, including Japan (25).
Summary
HOS studies have benefitted greatly from advances in technology, informatics, and the robustness of the analytical LC–MS toolkit. In addition, the wider scientific understanding of what is achievable has meant a recent quantum leap in the demand for—and development of—HDX–MS. Like a genie released from its bottle, this powerful capability cannot be put back in the darkness. It will only continue to grow and further inform our understanding of protein biotherapeutics.
St. John Skilton, PhD, is senior manager of late-stage development for pharmaceutical life sciences at Waters, tel: 508.377.8234.
References
1. T.E. Wales et al., Anal. Chem. 80 (17), 6815–6820 (2008).
2. R.E. Iacob, J.P. Murphy, and J.R. Engen, Rapid Commun. Mass Spectrom. 22 (18), 2898–2904 (2008).
3. J. Fang et al., Int. J. Mass Spectrom. 302 (1–3), 19–25 (2011).
4. R.E. Iacob and J.R. Engen, J. Am. Soc. Mass Spectrom. 23 (6), 1003–1010 (2012).
5. W. Hui et al., J. Am. Soc. Mass Spectrom. 23 (3), 498–504 (2012).
6. Z. Zhang and D.L. Smith, Protein Sci. 2 (4), 522–531 (1993).
7. T.E. Wales and J.R. Engen, Mass. Spectrom. Rev. 25 (1), 158–170 (2006).
8. D. Houde et al., Anal. Chem. 81 (7), 5966 (2009).
9. M.J. Chalmers et al., Anal. Chem. 78 (4), 1005–1014 (2006).
10. M.M. Zhu et al., Biochemistry 42 (51), 15388–15397 (2003).
11. Waters Corporation, "Localized Conformation Analysis of Mutated Human IgG1 by HDX–MS and nanoDSC," Application Note 720004224en (2012).
12. A. Baerga-Ortiz et al., Protein Sci. 11 (6), 1300–1308 (2002).
13. D. Houde, S.A. Berkowitz, and J.R. Engen, J. Pharm. Sci. 100 (6), 2071–2086 (2011).
14. J. Ahn, et al., poster at the 9th Symposium on the Practical Applications of Mass Spectrometry in the Biotechnology Industry (San Diego, CA, 2012).
15. S. B. Moorthy, S. Badireddy, and G.S. Anand, Int. J. Mass Spectrom. 302 (1–3), 157–166 (2011).
16. H. Xie et al., mAbs 2 (4), 1–16 (2010).
17. J. Ahn et al., J. Chromatogr. B Analyt. Technol. Biomed. Life Sci. 878 (3–4), 403–408 (2010).
18. G. Pasut and F.M. Veronese, Adv. Drug Deliv. Rev. 61 (13), 1177–1188 (2009).
19. F.M. Veronese and A. Mero, BioDrugs 22 (5), 315–329 (2008).
20. R. B. Greenwald et al., Adv. Drug Deliv. Rev. 55 (22), 217–250 (2003).
21. K.R. Reddy, Ann. Pharmacother. 34 (7–8), 915–923 (2000).
22. S. Kozlowski, Testimony, Subcommittee on Technology and Innovation Committee on Science and Technology, US House of Rep., Sept. 24, 2009.
23. FDA, "FDA Issues Draft Guidance on Biosimilar Product Development," Press Release (Silver Spring, MD, Feb. 9, 2012).
24. L. Heinemann and M. Hompesch, J. of Diabetes Sci. Technol. 5 (3) 741–54 (2011).
25. S. Nakazawa et al., poster at the 60th ASMS Conference on Mass Spectrometry and Allied Topics (Vancouver, BC, 2012).
Articles in this issue
over 13 years ago
Pharmaceutical Technology, Analytical Supplement 2012 (PDF)over 13 years ago
Moisture Matters in Lyophilized Drug Productover 13 years ago
A Novel Process for Developing Fully Human Monoclonal Antibodiesover 13 years ago
Improving Technology Transferover 13 years ago
Analytical Applicationsover 13 years ago
Using a Systematic Approach to Select Critical Process Parametersover 13 years ago
Nuclear Magnetic Resonance as a Bioprocessing QbD ApplicationNewsletter
Get the essential updates shaping the future of pharma manufacturing and compliance—subscribe today to Pharmaceutical Technology and never miss a breakthrough.


